Zimbra Elastic Stack
By: zimbra
Based on your feedback we have updated the Zimbra Elastic Stack guide to work with Ubuntu 22 and ELK 8.x! The guide has also been extended with steps on how to send log information from audit.log and nginx access and error logs to Elastic Stack.
This guide describes how to use Elastic Stack with Zimbra by using Centralized Logging based on RSyslog. The main benefits of using Elastic Stack combined with Centralized Logging:
- Makes it easy to search through and analyze historic logs.
- Visualization of log events to gather insights.
- Storing of logs for forensic research in case of getting hacked.
- Uptime and certificate monitoring.
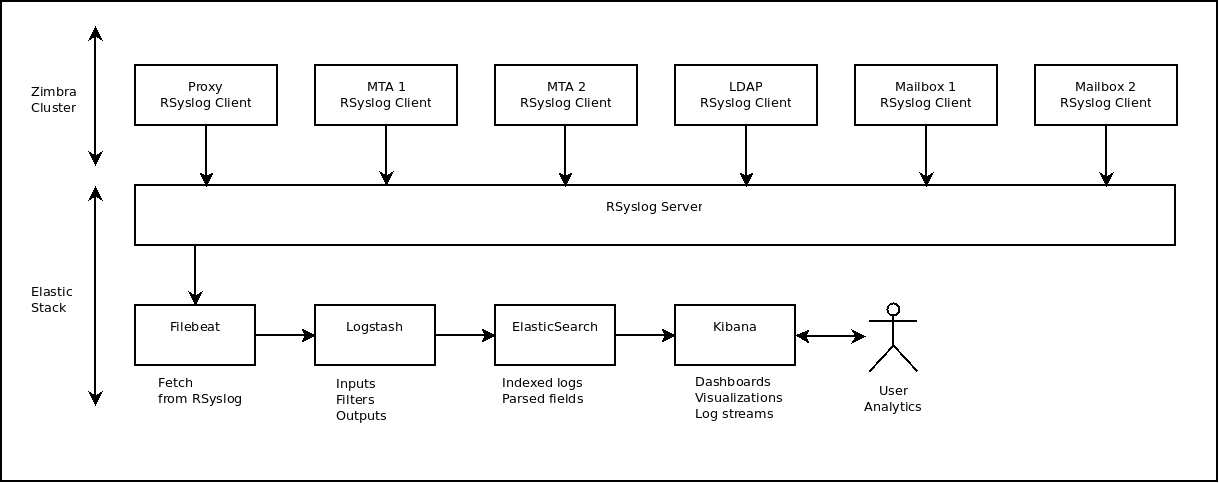
Both Zimbra and Elastic Stack consist of many components. The below diagram gives an overview of how the software components work together to make visualizations from raw log files. In the most simple form you can install Zimbra in a single server set-up and add another server for all the Elastic Stack components. Of course, if you plan to scale up you may split several of the software components across more virtual machines as required.
Example of a Zimbra Cluster with Elastic Stack and RSyslog.
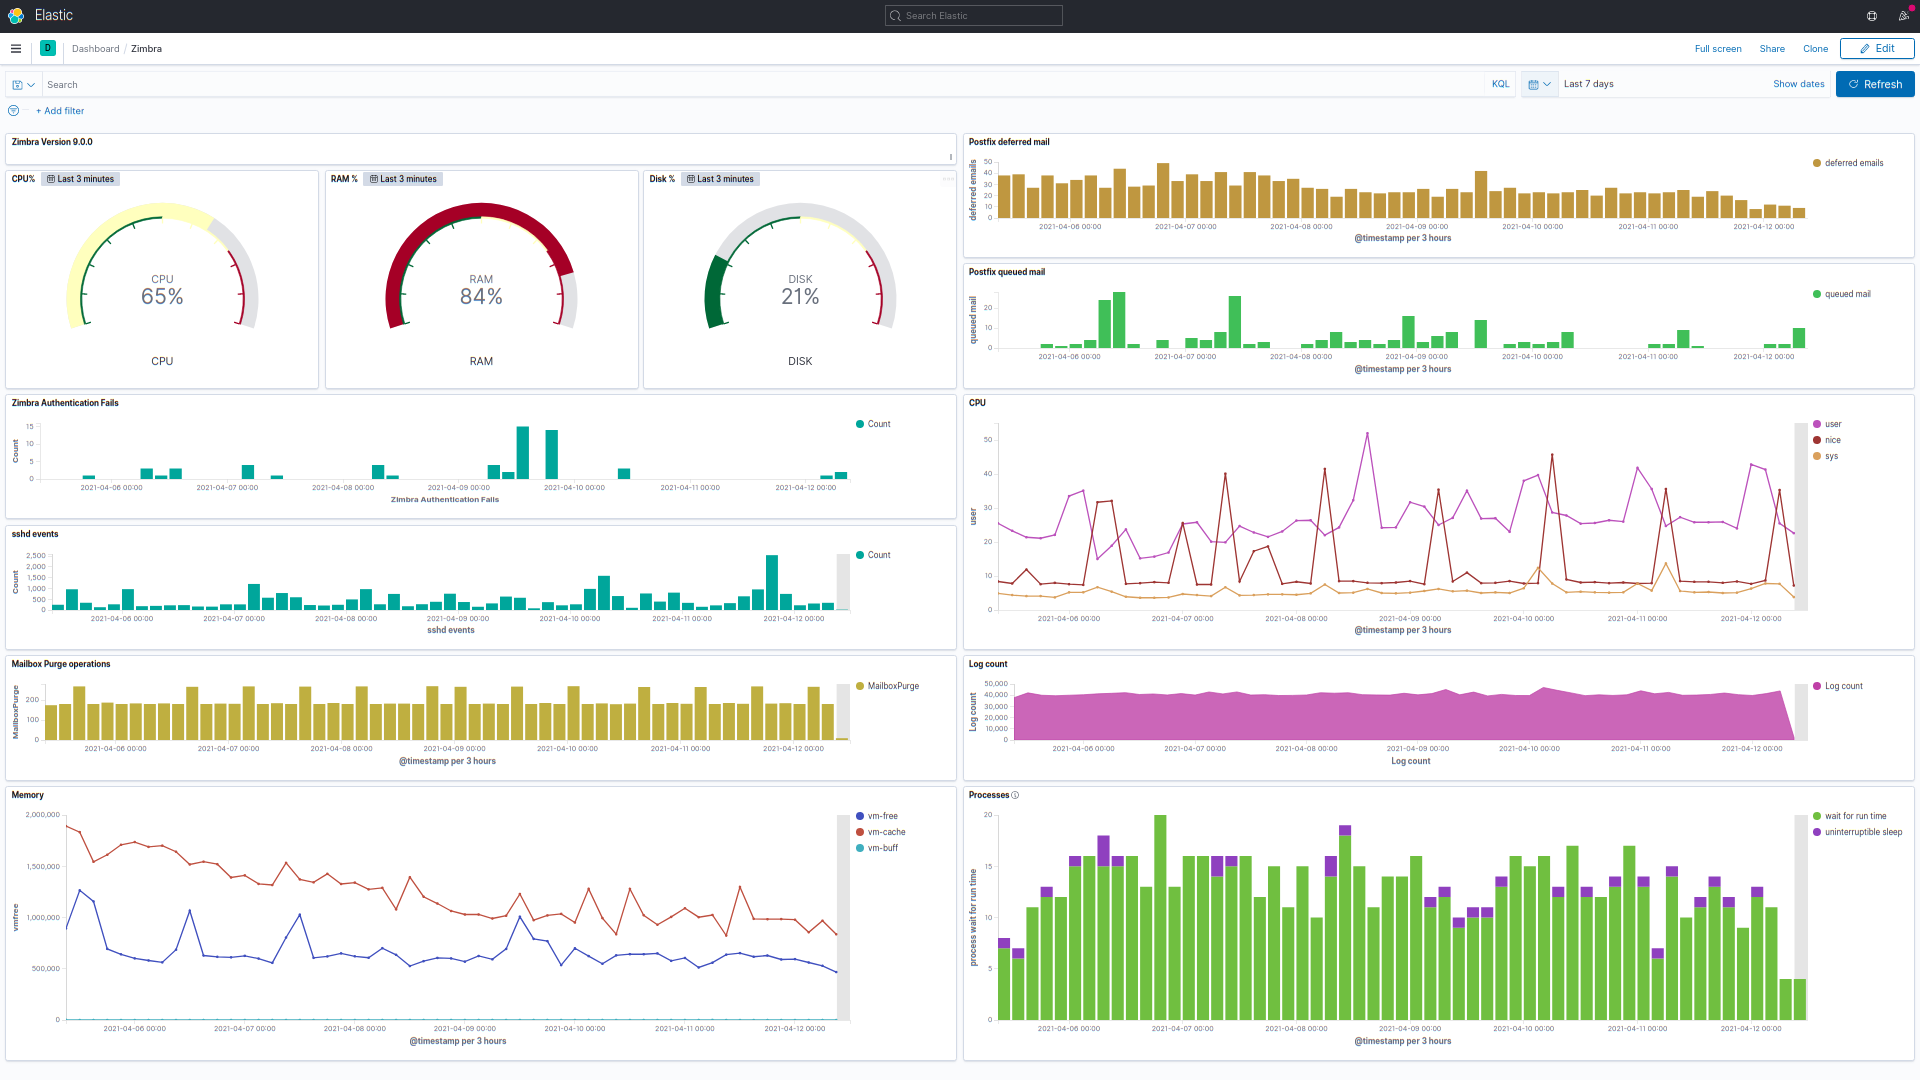
A basic Kibana dashboard for a Zimbra server would look like this:
Example Elastic Stack Dashboard on a Zimbra 9 installation.
Without Elastic Stack your server only keeps the most recent log files of all the events happening on your Zimbra server. Even though you can configure your system logging to delay the compression and purging of log files, eventually log files tend to become very large and there are several log files for the various components in the system. Finding a specific event across all these logs can be time consuming.
Logs that are parsed by Elastic Stack become searchable, so you don't have to do all sorts of command line tricks to search for events quickly and go back in time without spending extended periods of time waiting for search results.
In addition to the search, Elastic Stack allows you to create visualizations in a relatively easy way. This way you can get insights into the vital parameters of your system, including but not limited to Postfix e-mail traffic, spam filtering, disk usage and load, CPU and RAM usage, and security related events such as failed web-UI log-ins, failed SSH login attempts, IMAP and SMTP brute force attempts etc. In time this can help you to become proactive in dealing with system load issues and security threats.
Using RSyslog to gather the logs of your Zimbra servers has a number of benefits over using Elastic stack mechanisms to gather logs:
- No need to install Elastic Stack agent on your Zimbra servers.
- Avoid 3rd party software repositories on your Zimbra servers.
- RSyslog centralized logging will secure your logs in case your server logs become compromised because of hacking.
- RSyslog centralized logging is an industry standard for securing logs for forensic researchers.
- Maintainability.
With regards to maintainability, Elastic Stack is DevOps developed software. While there is nothing wrong with that, over time things tends to change a lot. This means the mechanisms (Logstash Forwarder/Filebeat) offered for gathering logs can change significantly. For example Logstash Forwarder is now deprecated and the configuration options for Filebeat change often, making it challenging to maintain, especially if you run a Zimbra cluster.
Please note that most of the config files and scripts that are in this guide are available in the Github repository. So if copy-pasting directly from this guide does not work, you should retrieve the config files and scripts by downloading them via Github.
See the full guide on Github.
Helpful Links
| Rating | No ratings or reviews |
| Downloads | 1435 |
| Latest Version | 0.1.4 |
| Categories | Developer Tools |
| Compatibility | ZCS 8.8.x , ZCS 9.0.x , ZCS 10.0.x |
| License | BSD 3-Clause |
| Created | on 6/26/21 |
| Updated | on 4/26/23 |